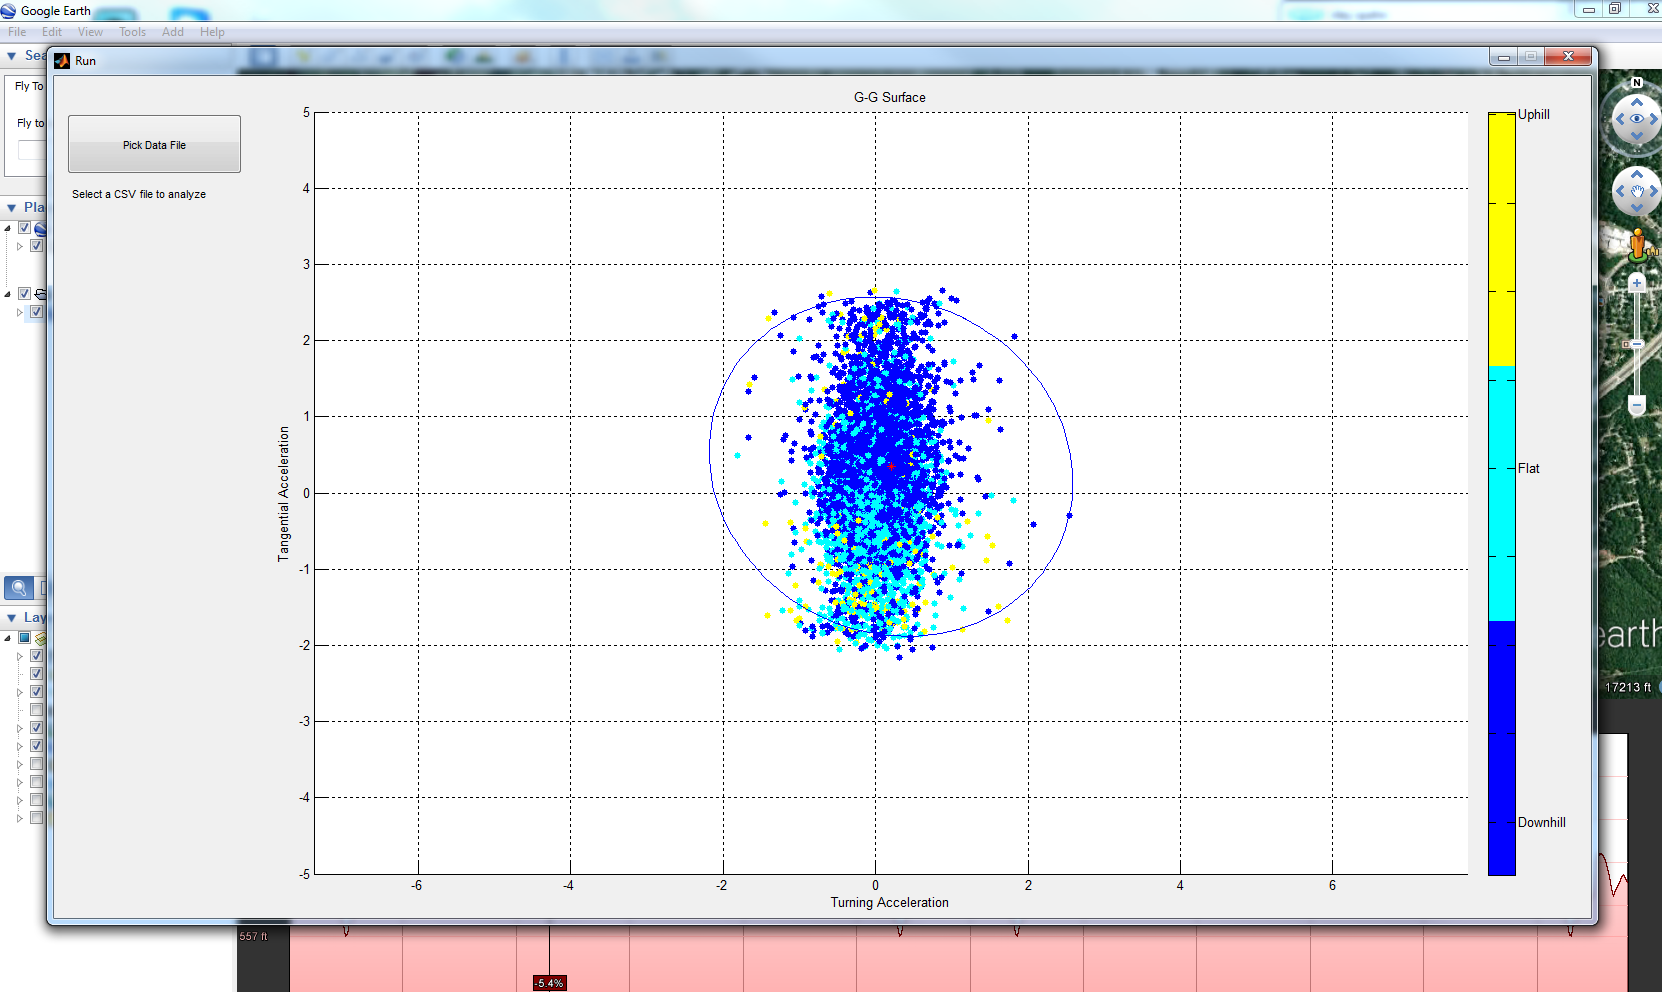
Turning Fast: Generating G-G Diagrams from iPhone Data
After reading this guy: http://cozybeehive.blogspot.com/2009/10/g-g-diagram-applied-to-bicycle-racing.html , I decided that it would be cool to be able to generate G-G diagrams from rides and compare them to friends, yourself, things like that. At first it seemed like a complex idea, needed to get accelerometers a DAQ, some kind of interface, ect. Then I remembered: I have a phone.
Kids these days, have it so easy. Just download this: http://www.wavefrontlabs.com/Wavefront_Labs/Sensor_Data.html , mount your iPhone to your stem, and go shred some mountain bike trails. You get home, your phone automatically connects to the wifi, and bam, your data is floating in the magic internet tubes in your house.
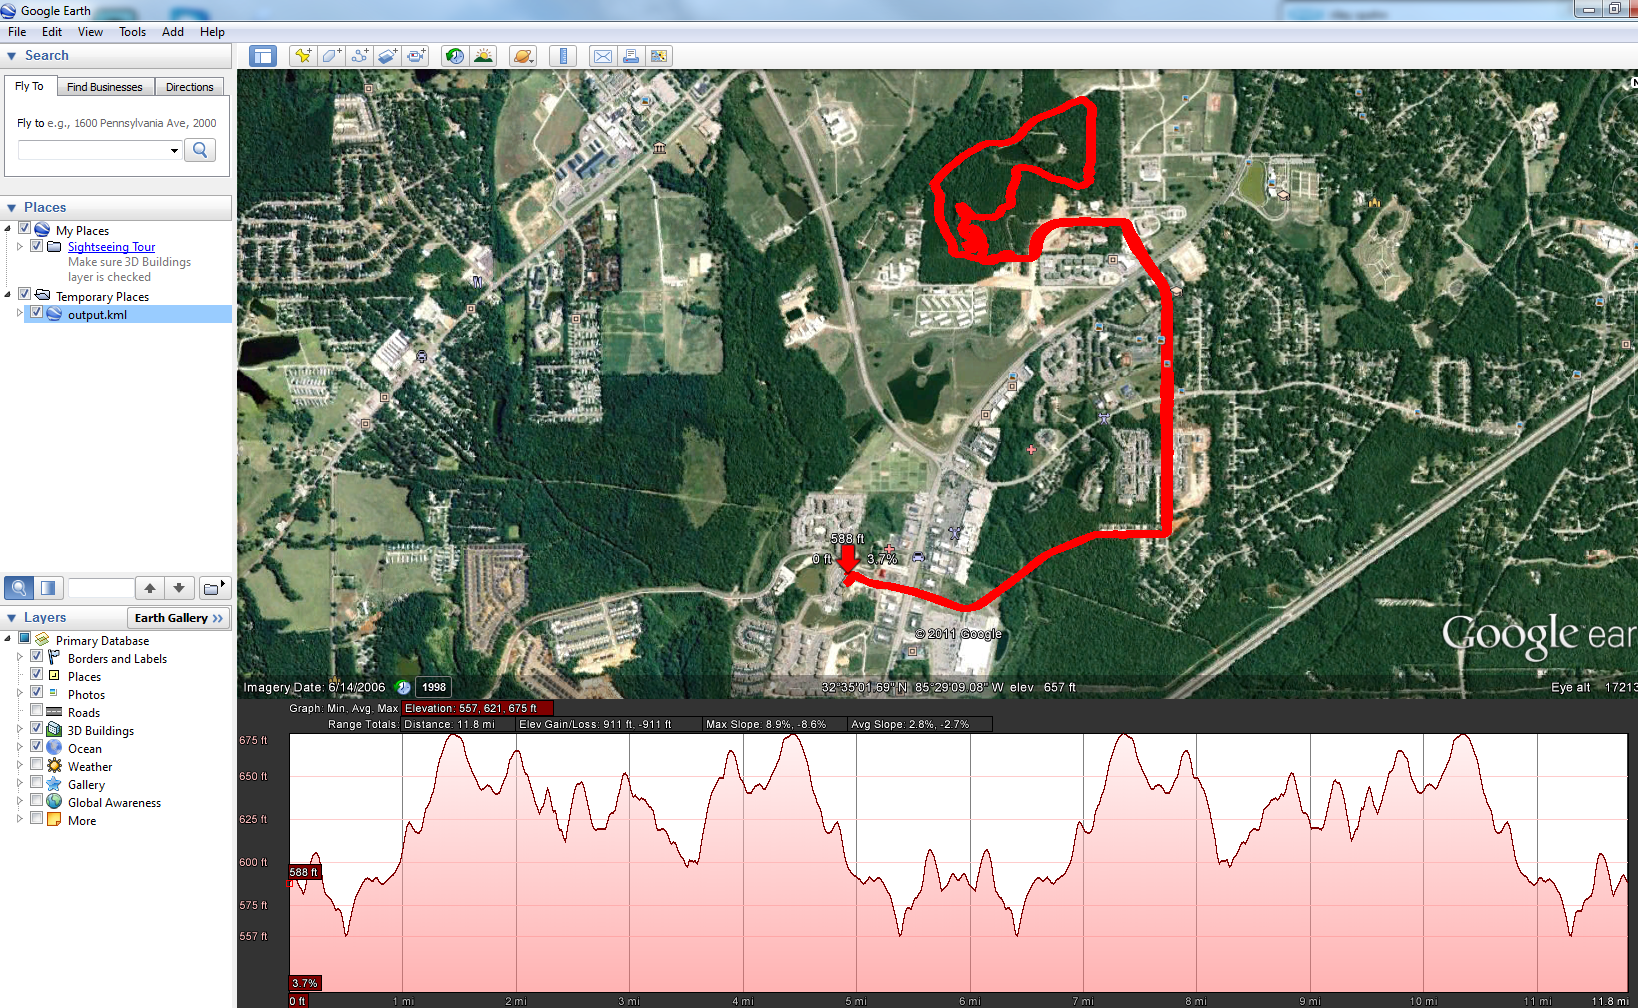
It actually gives a good bit of data, GPS, acceleration, gyro, and unit vector of gravity. I just used the accelerometers and the gravity vector to somewhat shoddily estimate normal and tangential accelerations. There is some error from physically turning the bars that you wouldn’t get if you mounted it on the toptube, but thats awkward. I also used the GPS data to toy with the Google Earth toolbox, which lets you export data in the right format to open it in Google Earth. It all fit into an absurdly simple MATLAB GUI, where you just open up your data, go take a shower, and come back to some cool charts. It takes a while to plot if you are taking samples at 100Hz for a few hours, which is over a million datapoints.
Down the road, a small LCD screen, accellerometer and microcontroller may be able to in real time generate a plot so you can try out different tire pressures/positions/ect. on the trail and get real time feedback on how they affect your ability to go around corners. For now I just do all of the analysis after the ride in MATLAB.
Stay in the loop
Get notified when I publish new posts. No spam, unsubscribe anytime.