Data-driven engineering team management with gitnoc and git-pandas
The management of engineering projects is very very different when it scales outside of one developer, and even more so when it scales outside of one repository. Devops and source control aside, as the number of contributors and repos increases, the ability for a manager to keep track of each developer and repository relative to each other increases in kind.
Data, especially incomplete data, cannot solve this problem entirely. There are contexts and biases that do not show up in git histories. Gitnoc aims to be a visualization layer on the lower-level git-pandas library to allow for data-driven human-in-the-loop management of engineering teams. The idea is to put as much relevant, concise data in front of the manager as possible, to let them good decisions quickly. It’s no where near complete, but a few examples of the kinds of decisions that can be informed (but not made) by git data:
- Hierarchical bus factor analysis can be used to find repositories or languages (file extensions) that have unusually low collaboration, and therefore risk to the team.
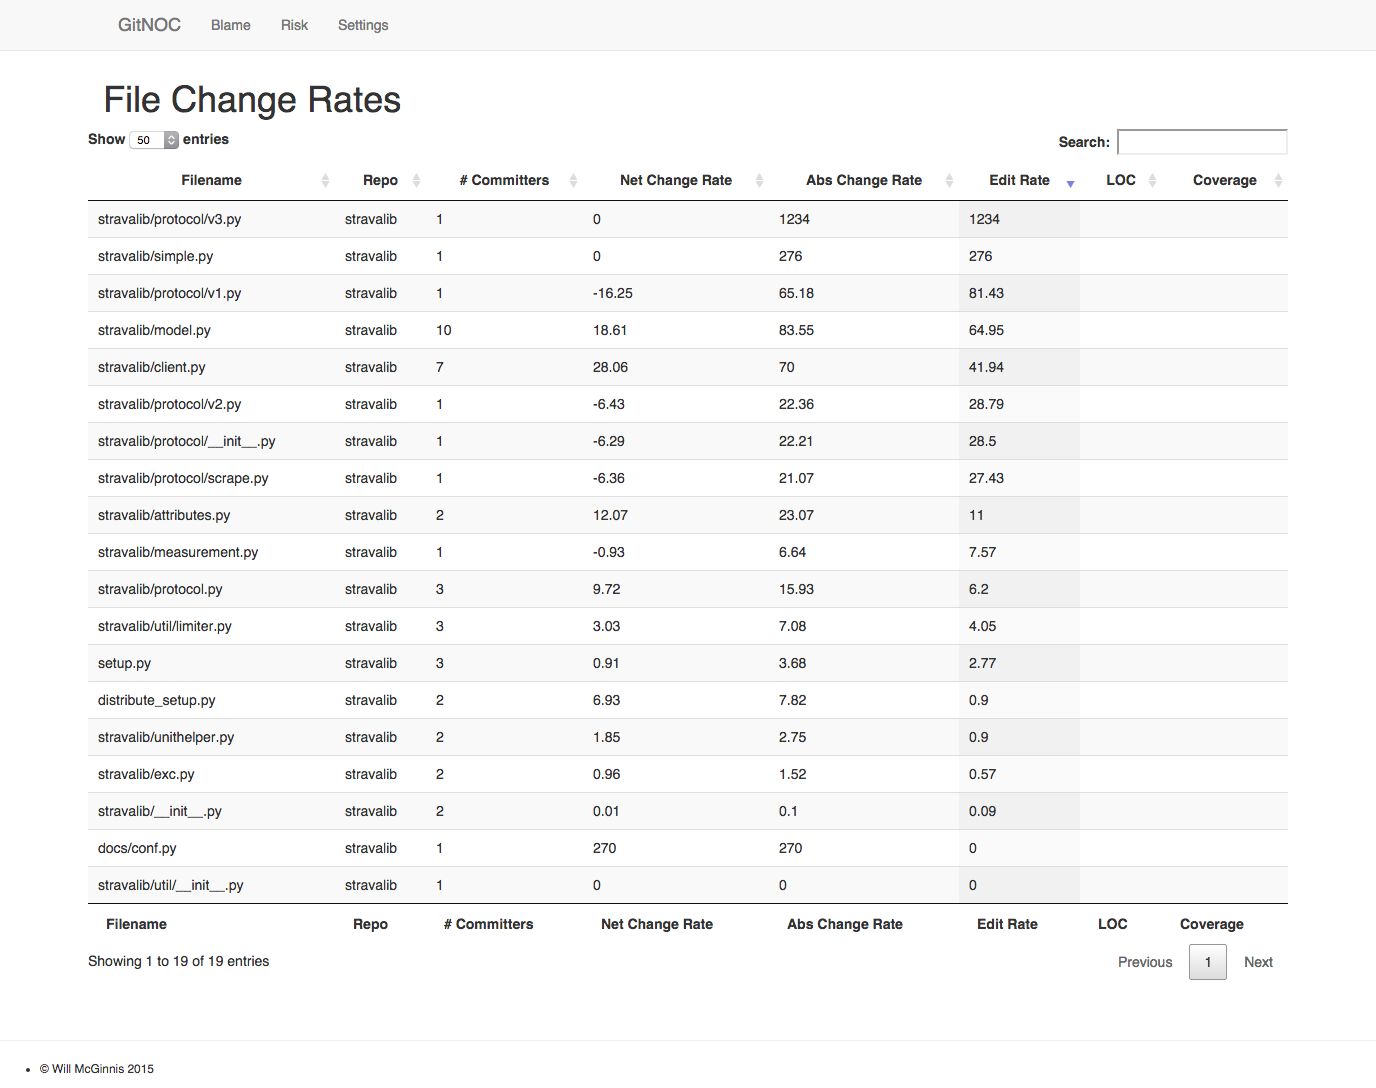
- File edit rates, growth rates, and test coverage can be joined together to identify files that are being edited frequently without growing, and which have low test coverage. These files are prime candidates for more and better testing in the short term.
- Cumulative project blame can help identify trends in the various repositories, which effects future maintenance burden, QA workload, and continuing education paths (if a specific repository is growing most quickly and it’s bus factor is low, train up more engineers to be able to contribute to it in the future).
- Refactors can be identified and flagged for code review.
- Stories can be assigned specifically to avoid single engineer bus factors.
- In larger organizations, job postings can be built based on where help is actually needed (big, growing repositories with high edit rates and low bus factors).
With all of that in mind, gitnoc now supports a few new things. Much is still left to do, but it is already a useful tool to pull up once a week. It’s technology is:
- git-pandas (of course)
- flask
- nvd3
- datatables
- rq and redis
It’s currently pretty slow for big sets of repositories, but soon I will add in some configuration options that should help that out.
The main page is the metrics tab. It is pretty basic, a punchcard and some leaderboards for the week, nothing too in depth.
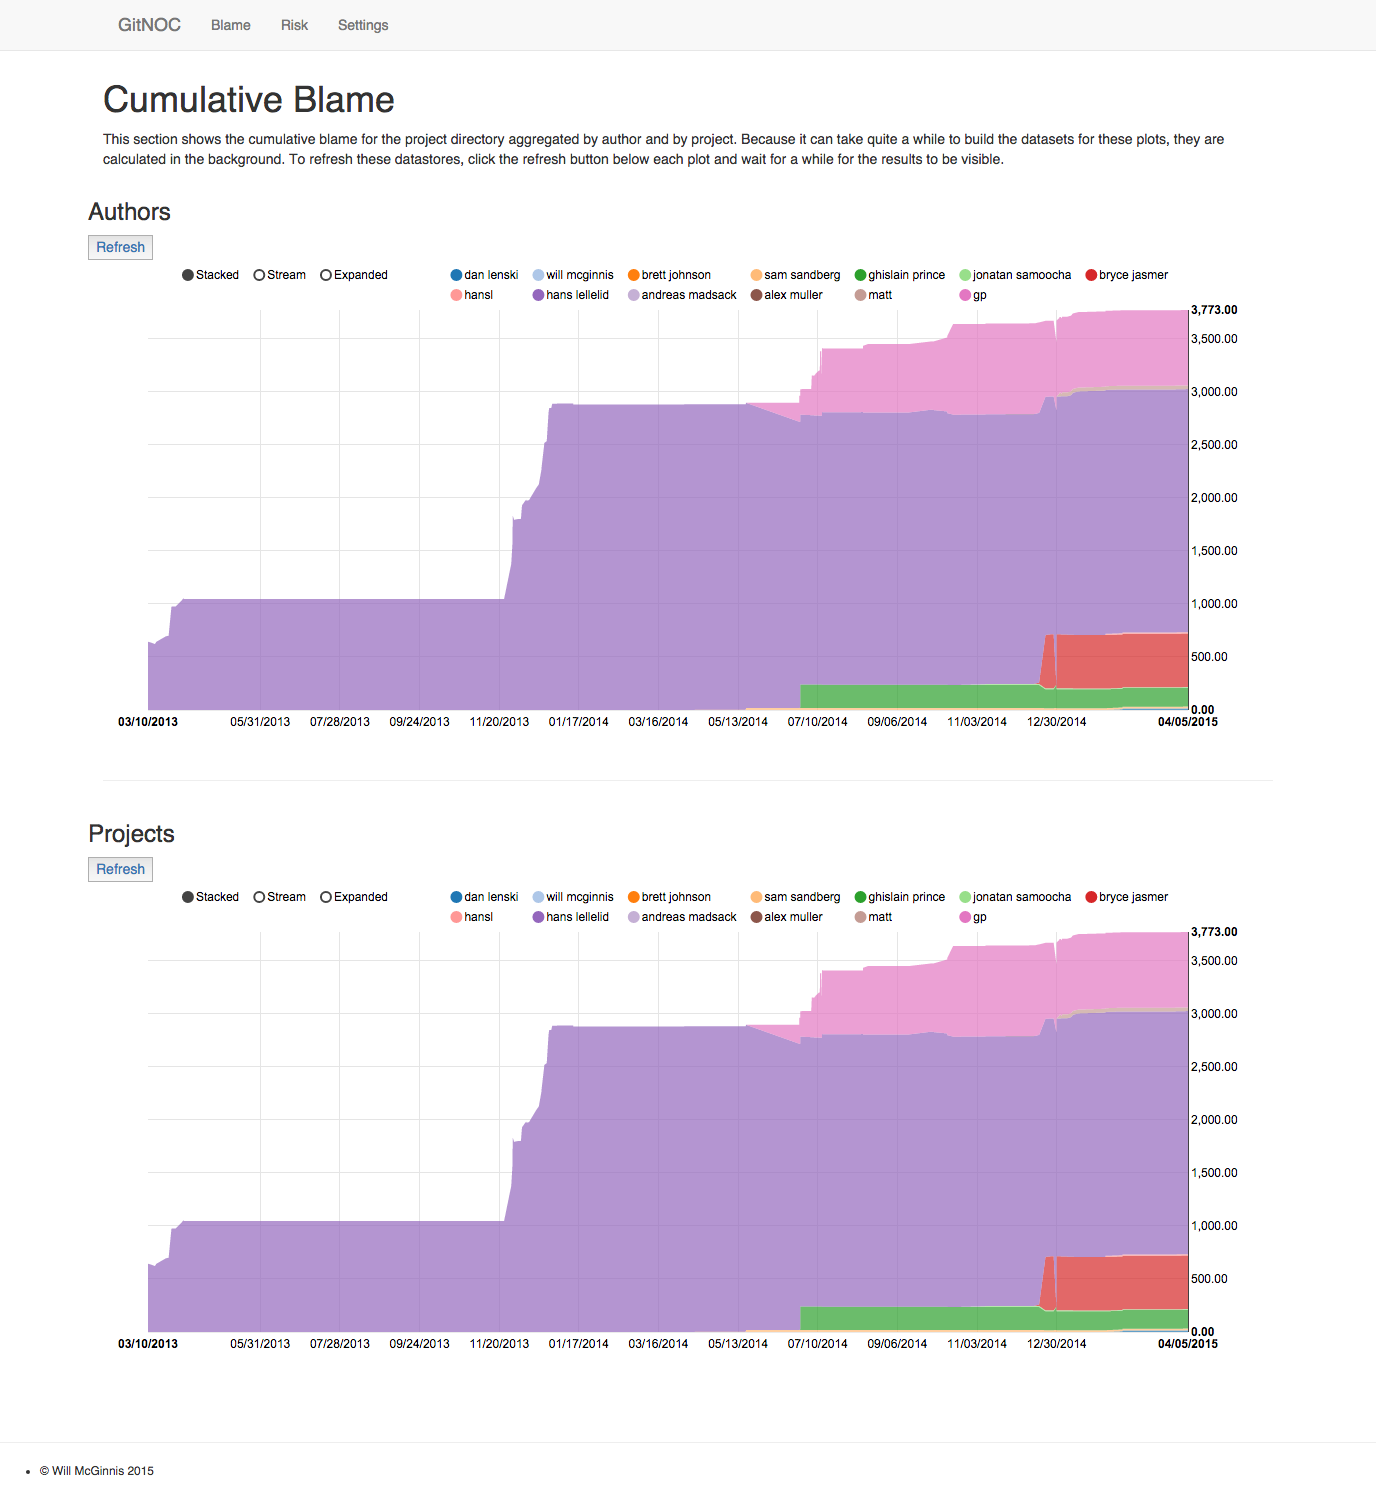
Next we have the cumulative blame page, which uses rq and redis to do the processing async, because it can take quite a long time.
Next there is the risk tab, which has file growth, edit, and coverage rates for the past 7 days (will later be configurable).
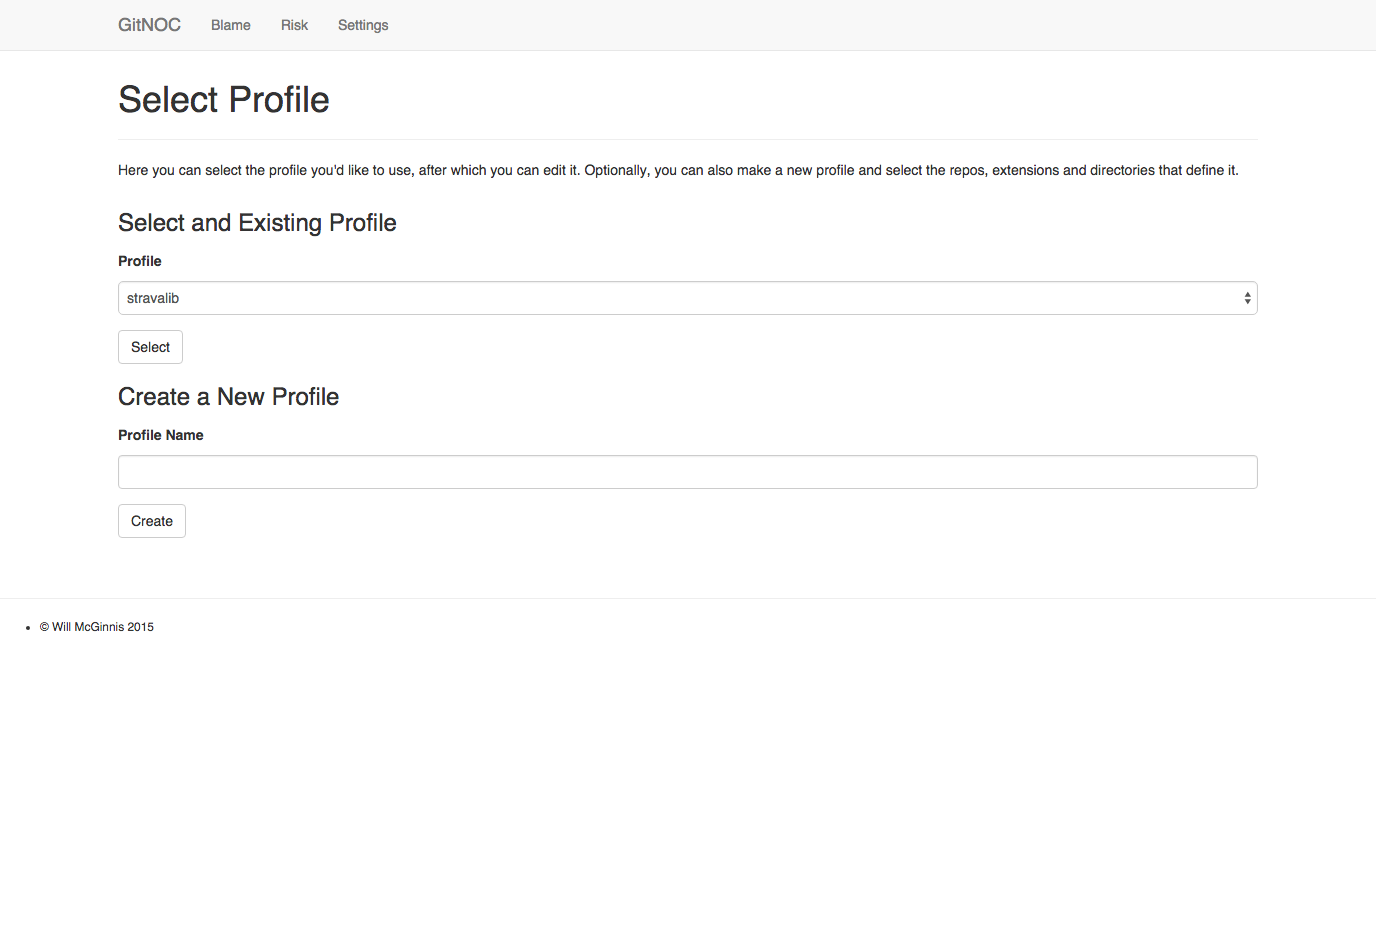
And finally there are the two pages for creating, selecting and editing the profile you are using (gitnoc supports multiple profiles for the management of different teams, projects, or different sets of languages).
The lowest hanging fruit missing is the hierarchical bus factor analysis page. That will let you explore the organization to find out which portions of the codebase are too dependent on one engineer.
I’m interested to know what other developers, engineers and managers think would help with the management of software teams. What charts or data would help you make decisions better or more quickly?
Check out the code, use it, fork it, send me pull requests:
Stay in the loop
Get notified when I publish new posts. No spam, unsubscribe anytime.