The Colley Matrix: A Linear Algebra Approach to Ratings
We’ve covered quite a range of rating systems in this series so far: Elo, Glicko-1, Glicko-2, TrueSkill, ECF, and DWZ. Now it’s time to explore something completely different: the Colley Matrix method.
Unlike the previous systems, which are based on iterative updates, the Colley Matrix takes a holistic, linear algebra approach to the rating problem.
The Origin Story: From Physics to Sports Rankings
The Colley Matrix method was developed by Dr. Wesley Colley, an astrophysicist, in the mid-1990s while studying at Princeton University. He published his formal paper in 2002, and the BCS adopted his rankings starting in 2001. It was originally designed to rank college football teams for the Bowl Championship Series (BCS) but has since been applied to many other sports and competitions.
What makes the Colley Matrix interesting is its mathematical foundation. Rather than updating ratings iteratively after each match (like Elo and its derivatives), it solves a system of linear equations to find the optimal ratings for all competitors simultaneously.
This approach has several advantages:
- It’s bias-free - the order of games doesn’t matter
- It naturally accounts for strength of schedule
- It has a unique, mathematically optimal solution
- It’s resistant to manipulation
The Colley Matrix was one of several computer ranking systems used in the BCS formula from 2004 until the BCS was replaced by the College Football Playoff in 2014.
How the Colley Matrix Works: Linear Algebra Magic
The Colley Matrix method is based on a simple idea: a team’s rating should be proportional to its winning percentage, adjusted for strength of schedule.
Here’s the basic approach:
- Start with all teams having a rating of 0.5
- Create a matrix equation that relates each team’s rating to:
- Their win-loss record
- The ratings of the teams they played against
- Solve the system of linear equations to find the optimal ratings
The key equation is:
C * r = b
Where:
- C is the Colley Matrix (a modified version of the Laplacian matrix)
- r is the vector of ratings we’re solving for
- b is a vector derived from each team’s win-loss record
The elements of the Colley Matrix are:
- C[i,i] = 2 + number of games played by team i
- C[i,j] = -number of games between teams i and j (if i ≠ j)
The elements of the b vector are:
- b[i] = 1 + (wins - losses)/2 for team i
Solving this system gives ratings between 0 and 1, with 0.5 being average, higher being better, and lower being worse.
Implementing Colley Matrix with Elote
Let’s see how the Colley Matrix works in practice with Elote:
from elote import ColleyMatrixCompetitor
import numpy as np
import matplotlib.pyplot as plt
import os

# Create some competitors
team_a = ColleyMatrixCompetitor()
team_b = ColleyMatrixCompetitor()
team_c = ColleyMatrixCompetitor()
team_d = ColleyMatrixCompetitor()

# Record some match results
team_a.beat(team_b)
team_a.beat(team_c)
team_b.beat(team_c)
team_b.beat(team_d)
team_c.beat(team_d)
team_d.beat(team_a)  # Create a cycle

# Check the ratings - they're recalculated after each match
teams = {"Team A": team_a, "Team B": team_b, "Team C": team_c, "Team D": team_d}

print("Basic Colley Matrix Ratings:")
sorted_teams = sorted(teams.items(), key=lambda x: x[1].rating, reverse=True)
for i, (name, team) in enumerate(sorted_teams):
    print(f"{i+1}. {name}: {team.rating:.4f}")

# Visualize the ratings
team_names = [name for name, _ in sorted_teams]
ratings = [team.rating for _, team in sorted_teams]

plt.figure(figsize=(10, 6))
plt.barh(team_names, ratings, color='skyblue')
plt.axvline(x=0.5, color='red', linestyle='--', alpha=0.7, label='Average (0.5)')
plt.xlabel('Colley Rating')
plt.title('Basic Colley Matrix Ratings')
plt.xlim(0, 1)
plt.grid(axis='x', alpha=0.3)
plt.legend()

# Save the figure
project_root = os.path.abspath(os.path.join(os.path.dirname(__file__), '..', '..'))
output_dir = os.path.join(project_root, 'static', 'images', 'elote', '07-colley-matrix-rating-system')
os.makedirs(output_dir, exist_ok=True)
plt.savefig(os.path.join(output_dir, 'basic_colley_ratings.png'))
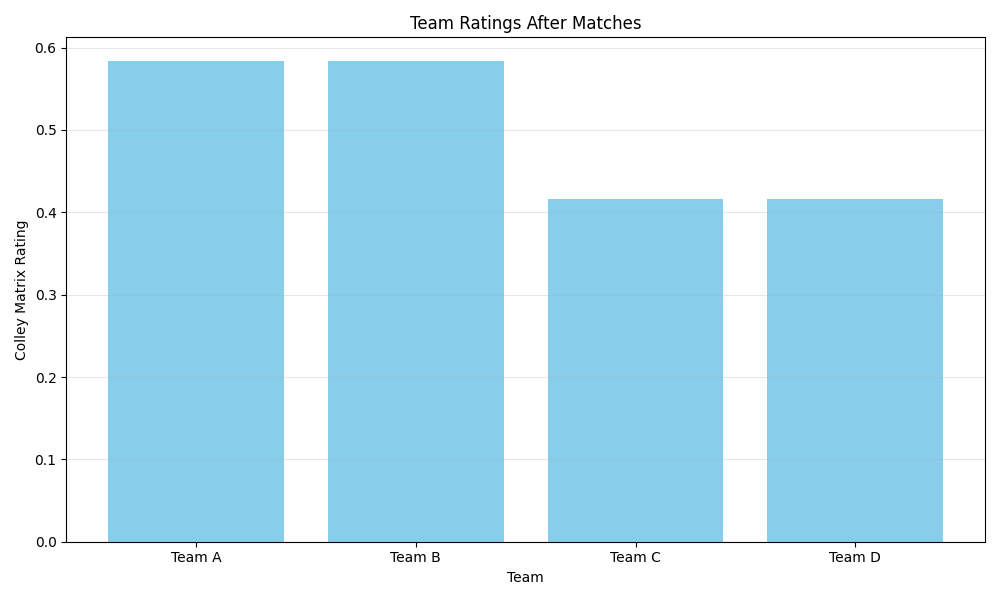
Notice that we need to update all ratings simultaneously, which is different from the other systems we’ve explored. The Colley Matrix considers the entire network of games at once to determine the optimal ratings.
Colley Matrix vs. Simple Win Percentage
One of the key advantages of the Colley Matrix is that it accounts for strength of schedule. Let’s compare Colley ratings to simple win percentages:
import random
import numpy as np
import matplotlib.pyplot as plt
import os
from elote import ColleyMatrixCompetitor

# Create teams with different true strengths
true_strengths = {
    "Alabama": 0.9,
    "Georgia": 0.85,
    "Ohio State": 0.8,
    "Michigan": 0.75,
    "Clemson": 0.7,
    "Notre Dame": 0.65,
    "Oklahoma": 0.6,
    "Texas": 0.55,
    "LSU": 0.5,
    "Florida": 0.45,
    "Penn State": 0.4,
    "Oregon": 0.35,
    "Wisconsin": 0.3,
    "USC": 0.25,
    "Auburn": 0.2,
    "Iowa": 0.15
}

# Create ColleyMatrixCompetitor for each team
competitors = {name: ColleyMatrixCompetitor() for name in true_strengths}
win_counts = {name: 0 for name in true_strengths}
loss_counts = {name: 0 for name in true_strengths}

# Generate 100 games with biased scheduling (similar strengths play each other)
for _ in range(100):
    team_list = list(true_strengths.keys())
    strengths = list(true_strengths.values())

    # Pick first team randomly
    team1 = random.choice(team_list)
    strength1 = true_strengths[team1]

    # Pick second team with bias toward similar strength
    weights = [1 / (abs(strength1 - s) + 0.1) for s in strengths]
    team2 = random.choices(team_list, weights=weights, k=1)[0]

    while team2 == team1:
        team2 = random.choices(team_list, weights=weights, k=1)[0]

    # Determine winner based on team strengths
    if random.random() < (true_strengths[team1] / (true_strengths[team1] + true_strengths[team2])):
        competitors[team1].beat(competitors[team2])
        win_counts[team1] += 1
        loss_counts[team2] += 1
    else:
        competitors[team2].beat(competitors[team1])
        win_counts[team2] += 1
        loss_counts[team1] += 1

# Get Colley ratings and calculate win percentages
colley_ratings = {name: comp.rating for name, comp in competitors.items()}
win_percentages = {name: win_counts[name] / (win_counts[name] + loss_counts[name])
                   if (win_counts[name] + loss_counts[name]) > 0 else 0.5
                   for name in true_strengths}

# Sort teams by Colley rating
sorted_teams = sorted(true_strengths.keys(), key=lambda t: colley_ratings[t], reverse=True)

# Prepare data for plotting
colley_values = [colley_ratings[team] for team in sorted_teams]
winpct_values = [win_percentages[team] for team in sorted_teams]
true_strength = [true_strengths[team] for team in sorted_teams]

# Plot comparison
plt.figure(figsize=(12, 8))
x = np.arange(len(sorted_teams))
width = 0.25

plt.bar(x - width, colley_values, width, label='Colley Rating', color='skyblue')
plt.bar(x, winpct_values, width, label='Win Percentage', color='lightgreen')
plt.bar(x + width, true_strength, width, label='True Strength', color='salmon')

plt.axhline(y=0.5, color='red', linestyle='--', alpha=0.5, label='Average (0.5)')
plt.xlabel('Teams')
plt.ylabel('Rating')
plt.title('Colley Matrix vs. Win Percentage vs. True Strength')
plt.xticks(x, sorted_teams, rotation=90)
plt.legend()
plt.tight_layout()
plt.savefig('colley_vs_winpct.png')
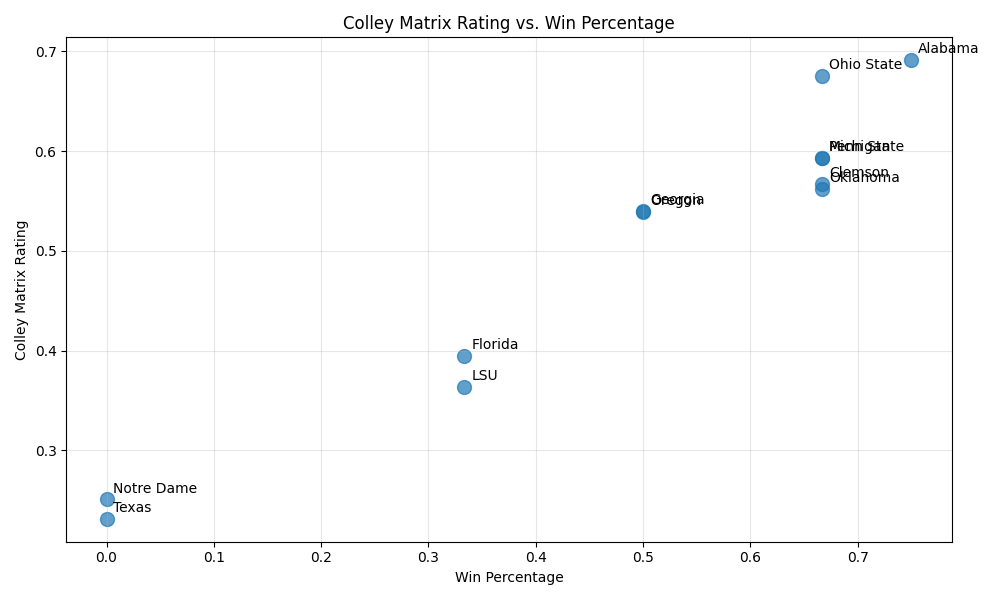
This comparison shows how the Colley Matrix adjusts for strength of schedule. Teams that play tougher opponents get a boost in their Colley rating compared to their simple win percentage, while teams that play weaker opponents see their Colley rating reduced.
Real-World Example: College Football Rankings
Let’s use the Colley Matrix to rank college football teams based on a simplified set of game results:
from elote import ColleyMatrixCompetitor
import matplotlib.pyplot as plt
# Create ColleyMatrixCompetitor for each team
teams = {
"Alabama": ColleyMatrixCompetitor(),
"Ohio State": ColleyMatrixCompetitor(),
"Georgia": ColleyMatrixCompetitor(),
"LSU": ColleyMatrixCompetitor(),
"Auburn": ColleyMatrixCompetitor(),
"Florida": ColleyMatrixCompetitor(),
"Tennessee": ColleyMatrixCompetitor(),
"Michigan": ColleyMatrixCompetitor(),
"Penn State": ColleyMatrixCompetitor(),
"Wisconsin": ColleyMatrixCompetitor(),
"Notre Dame": ColleyMatrixCompetitor(),
"USC": ColleyMatrixCompetitor(),
"Clemson": ColleyMatrixCompetitor(),
"Florida State": ColleyMatrixCompetitor(),
"Georgia Tech": ColleyMatrixCompetitor(),
"Oklahoma": ColleyMatrixCompetitor(),
"Texas": ColleyMatrixCompetitor(),
"Oklahoma State": ColleyMatrixCompetitor(),
}
# Record game results (first team beats second team)
teams["Alabama"].beat(teams["Ohio State"])
teams["Alabama"].beat(teams["Georgia"])
teams["Alabama"].beat(teams["LSU"])
teams["Alabama"].beat(teams["Auburn"])
teams["Georgia"].beat(teams["Florida"])
teams["Georgia"].beat(teams["Tennessee"])
teams["Ohio State"].beat(teams["Michigan"])
teams["Ohio State"].beat(teams["Penn State"])
teams["Michigan"].beat(teams["Wisconsin"])
teams["Michigan"].beat(teams["Penn State"])
teams["Notre Dame"].beat(teams["USC"])
teams["Notre Dame"].beat(teams["Clemson"])
teams["Clemson"].beat(teams["Florida State"])
teams["Clemson"].beat(teams["Georgia Tech"])
teams["Oklahoma"].beat(teams["Texas"])
teams["Oklahoma"].beat(teams["Oklahoma State"])
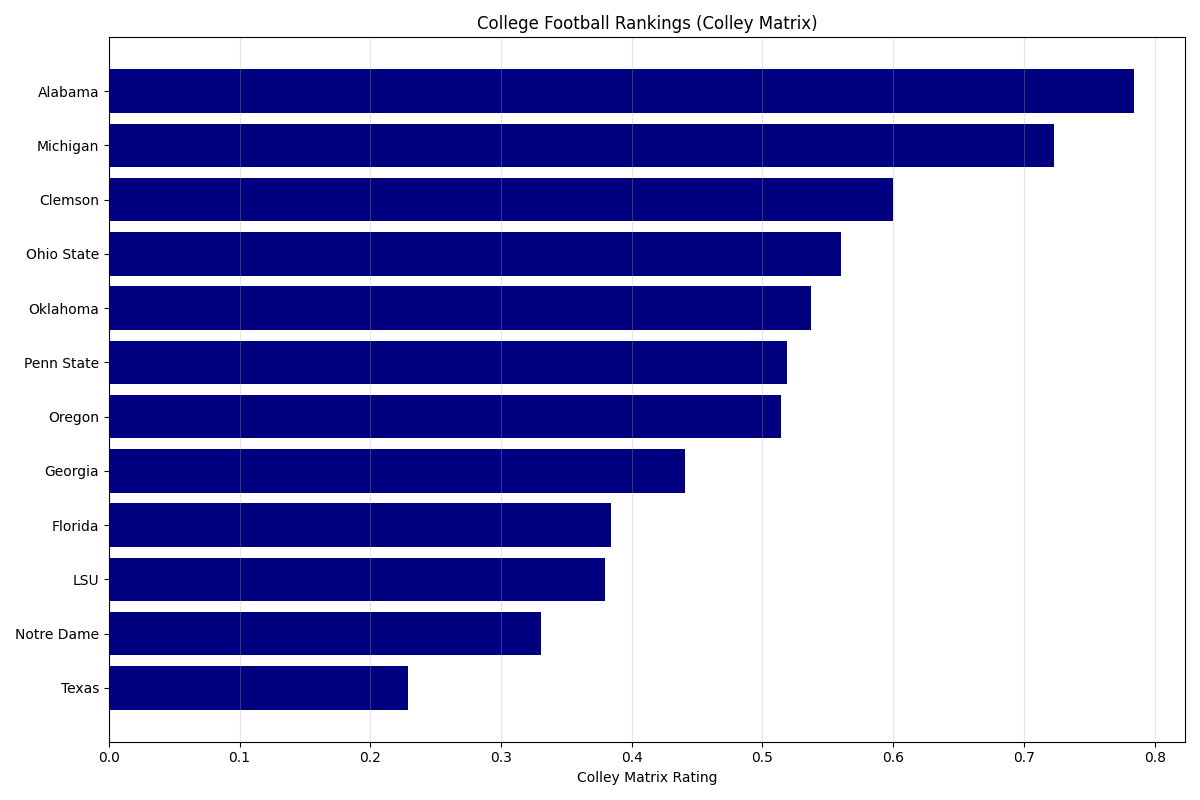
# Display rankings
print("\nCollege Football Rankings:")
sorted_teams = sorted(teams.items(), key=lambda x: x[1].rating, reverse=True)
for i, (name, team) in enumerate(sorted_teams):
print(f"{i+1}. {name}: {team.rating:.4f}")
# Visualize the top 10
top_10 = sorted_teams[:10]
team_names = [name for name, _ in top_10]
rating_values = [team.rating for _, team in top_10]
plt.figure(figsize=(12, 8))
plt.barh(team_names[::-1], rating_values[::-1], color='skyblue')
plt.axvline(x=0.5, color='red', linestyle='--', alpha=0.7, label='Average (0.5)')
plt.xlabel('Colley Rating')
plt.title('College Football Rankings (Colley Matrix)')
plt.xlim(0, 1)
plt.grid(axis='x', alpha=0.3)
plt.legend()
plt.tight_layout()
plt.savefig('football_rankings.png')
Now let’s see how the rankings change when we add some new game results:
# Add some new game results
teams["Ohio State"].beat(teams["Alabama"])  # Upset!
teams["Michigan"].beat(teams["Ohio State"])
teams["Georgia"].beat(teams["Alabama"])
teams["Notre Dame"].beat(teams["Michigan"])
teams["Penn State"].beat(teams["Wisconsin"])

# Check updated rankings (ratings are recalculated automatically)
print("\nUpdated College Football Rankings:")
sorted_teams = sorted(teams.items(), key=lambda x: x[1].rating, reverse=True)
for i, (name, team) in enumerate(sorted_teams):
    print(f"{i+1}. {name}: {team.rating:.4f}")
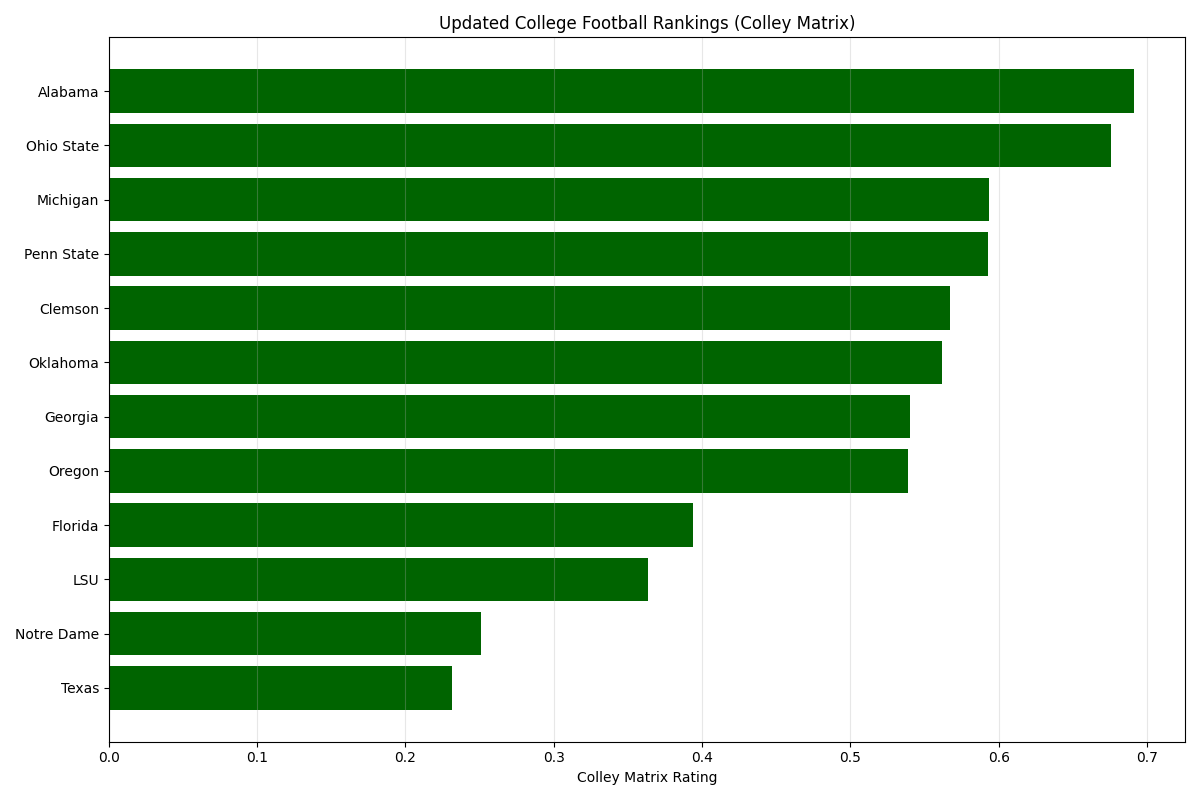
Notice how the rankings shift after adding new game results. The Colley Matrix recalculates all ratings simultaneously, taking into account the entire network of games.
Pros and Cons of the Colley Matrix
Pros:
- Holistic approach: Considers all games simultaneously
- Order-independent: The sequence of games doesn’t affect the final ratings
- Strength of schedule: Naturally accounts for opponent quality
- Mathematically elegant: Has a unique, optimal solution
- Transparent: Clear mathematical foundation
- Efficient: Can handle large numbers of teams and games
Cons:
- Requires all data upfront: Can’t update incrementally like Elo
- Less intuitive: Linear algebra approach is harder to explain
- No uncertainty measure: Unlike Glicko, doesn’t track rating reliability
- Limited to win/loss: Doesn’t account for margin of victory
- Batch processing: Must recalculate all ratings when new data arrives
When to Use the Colley Matrix
The Colley Matrix is best suited for:
- Ranking systems where all games are known in advance
- Sports with relatively few games per team (like college football)
- Situations where strength of schedule varies significantly
- Applications where transparency and mathematical rigor are important
- Rankings that need to be bias-free regarding game order
Conclusion: The Power of Linear Algebra in Ratings
The Colley Matrix demonstrates how linear algebra can provide an elegant solution to the rating problem. By considering all games simultaneously and solving a system of equations, it produces ratings that naturally account for strength of schedule and are free from order bias.
While it may not be as widely known as Elo, the Colley Matrix offers a mathematically rigorous approach to ratings that has proven its worth in college football and other applications. Its unique approach makes it a valuable addition to any rating system designer’s toolkit.
In our next post, we’ll explore the Ensemble Rating System, which combines multiple rating methods to create a more robust and accurate rating.
Stay in the loop
Get notified when I publish new posts. No spam, unsubscribe anytime.