Whole-History Rating: Ratings With a Past Tense
Every rating system in elote answers the same question: how good is this competitor, right now. Whole-History Rating answers a different one, and it is the only system in the library that can.
How good were they in October?
That sounds like something any system can answer. Save Elo’s rating every week and you have a history. But that history is a record of what Elo believed at the time, and what it believed in October was formed without knowing anything that happened in November. WHR’s October rating is an estimate of October strength made with the benefit of the entire season, and those are different objects.
The model
Start with Bradley-Terry. Each competitor has a latent strength, the probability that i beats j is a logistic function of the difference, and you fit the strengths that make the observed results most likely. Fit that to eight seasons and you get one number per competitor, which asserts that nobody’s strength changed in eight years.
WHR replaces the number with a function of time. Every competitor gets one latent rating per playing day, and consecutive days are tied together by a prior that says strength wanders like a random walk:
r(day n+1) - r(day n) ~ Normal(0, w2 * elapsed_days)
w2 is the drift rate, in Elo points squared per day, and it is the whole time model: how much do you believe a competitor’s true strength can change overnight.
Two forces then pull on the fit. The results pull each day’s rating toward whatever explains that day’s games. The prior pulls consecutive days toward each other. A competitor who plays every week gets a curve pinned tightly by evidence. A competitor who disappears for a year comes back with a rating the prior has let drift a long way from where they left it, which is the correct amount of doubt to have about someone you have not seen in a year.
Everything is fitted jointly, which is where the name comes from and where the cost comes from. Every result couples two competitors on one day, every day couples to its neighbours, and the whole connected component has to be solved at once. elote does it as a bounded sequence of per-competitor tridiagonal Newton updates, run lazily so the work happens when you ask for a rating rather than when you record a result.
What you get
competitor.rating_at(date(2021, 10, 15))   # strength on a given day
competitor.rating_history()                 # the whole fitted curve
Fitted over 2015 to 2022 of college football, those curves look like this:
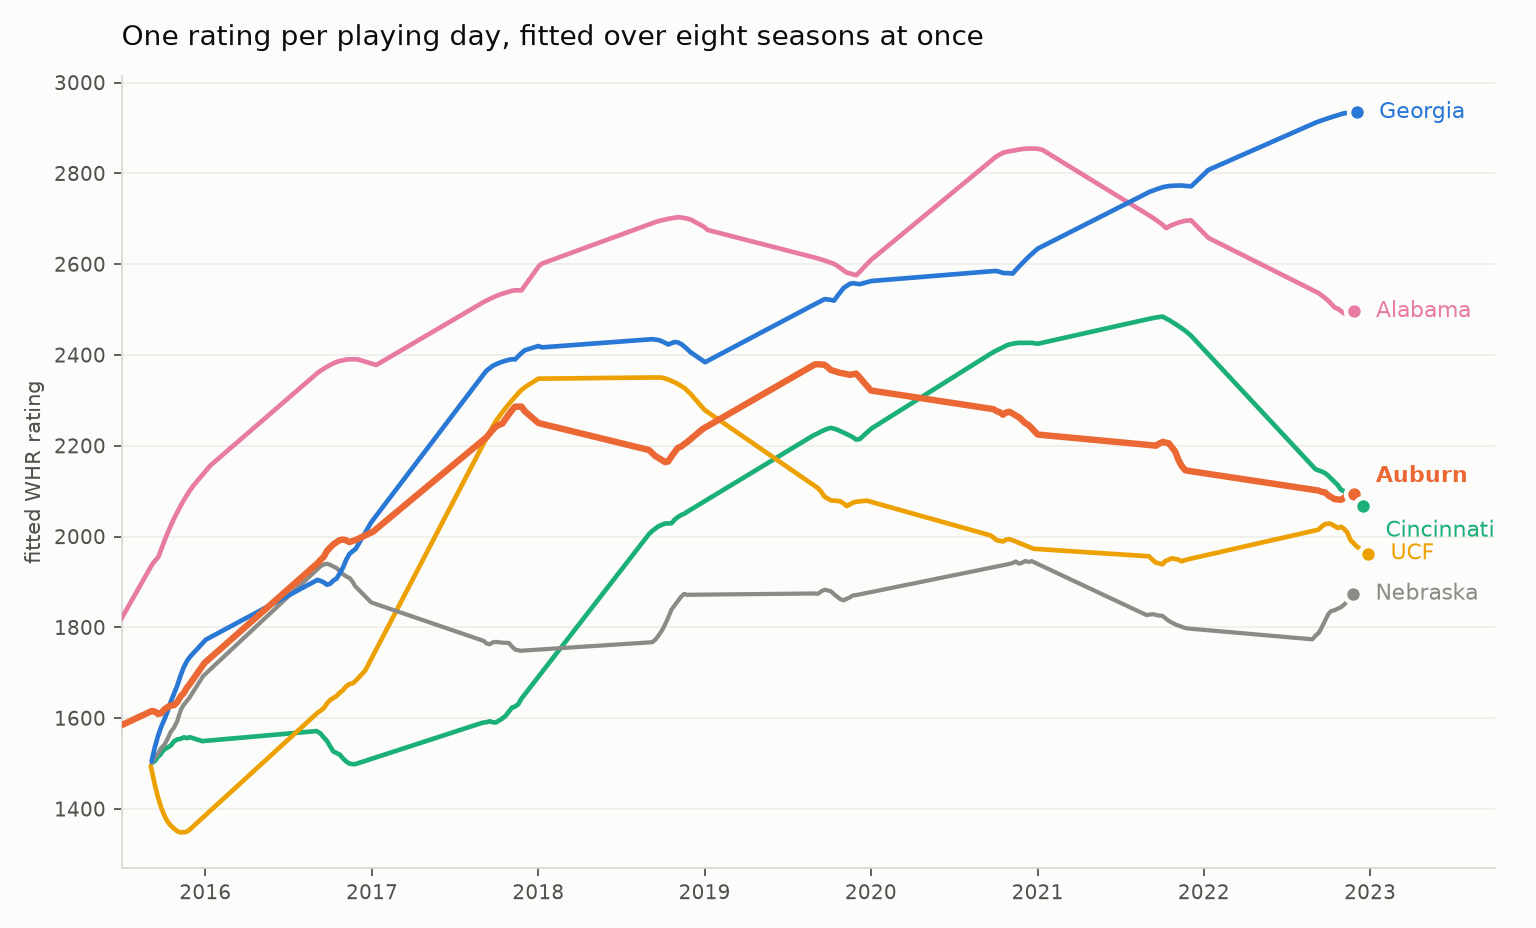
Every one of those shapes is a story you can check against what actually happened.
Auburn and Georgia are the same team through 2016, tracking each other almost exactly, and then they separate: Auburn tops out around 2019 and slides for four straight seasons while Georgia keeps climbing. Both facts are visible in the curve before you know either program’s history, and the gap between those two lines from 2019 onward is the SEC West problem stated as a picture.
UCF climbs almost vertically through 2017, which is the undefeated season, holds a plateau through 2018, and then slides as the roster that did it moves on. Cincinnati spends four years grinding upward to a 2021 peak, which is the year they made the playoff, and then falls away sharply in 2022 after the staff that built them left. Alabama peaks around 2018, peaks again in 2020, and is passed by Georgia in 2022. Nebraska drifts gently downhill for eight years.
None of that was labelled. It falls out of fitting one curve per team to results alone.
The retrospective quality is the point. Cincinnati’s 2019 rating on that chart is not what anyone thought of Cincinnati in 2019. It is what their 2019 looks like knowing they would beat Notre Dame in 2021, because WHR uses the whole history to decide how good every earlier version of them must have been.
The one parameter
w2 sets how fast strength is allowed to move, and it is worth calibrating for your sport. Higher values let ratings chase recent results; lower values hold competitors near where they have been. elote’s tune() runs the sweep against a walk-forward evaluation:
from elote import group_by_period, tune, WholeHistoryRatingCompetitor

periods = group_by_period(rows)
results = tune(
    WholeHistoryRatingCompetitor,
    {"w2": [1, 10, 30, 100, 300]},
    periods,
    warmup=23,
)
print(results[0])          # best by log loss
On eight seasons of college football:
| w2 | implied weekly drift | accuracy | log loss |
|---|---|---|---|
| 1 | 2.6 Elo | 0.6752 | 0.6527 |
| 10 | 8.4 Elo | 0.6902 | 0.5874 |
| 30 | 14.5 Elo | 0.6995 | 0.5632 |
| 100 | 26.5 Elo | 0.7046 | 0.5590 |
| 300 | 45.8 Elo | 0.7049 | 0.5895 |
The middle column is the useful way to read it. w2 = 100 says a team’s true strength moves about 26 Elo points in a typical week between games, which is a defensible claim about college football: rosters develop, injuries happen, and a November team is genuinely not its September self.
Notice that accuracy and log loss disagree about the top. Accuracy prefers 300, log loss prefers 100, and log loss is the one to trust if you are going to use the probability for anything beyond reading off a favourite. Accuracy only asks which side of 0.5 you landed on, so it cannot distinguish a confident correct pick from a lucky one.
What it costs
In the twelve-system benchmark, WHR predicts college football at 0.7053, which puts it fifth, about a point behind Glicko-2. It takes 608 seconds to do it where Glicko-2 takes under one.
That is the honest trade. For forecasting next Saturday, Glicko-2 is better and roughly a thousand times cheaper, and there is no argument for WHR.
For the retrospective question there is no competition, because nothing else in the library is answering it. If you want to know when a program peaked, whether the team that won it in year three was stronger than the team that lost in year one, or how strong the field was the season somebody went undefeated, WHR is built for exactly that and the incremental systems structurally cannot do it. Their historical ratings are contaminated by what they had not yet seen.
Two questions, two tools. It is worth being clear which one you are asking before picking.
Trying it
from datetime import datetime
from elote import LambdaArena, WholeHistoryRatingCompetitor

arena = LambdaArena(lambda a, b, attributes=None: True,
                    base_competitor=WholeHistoryRatingCompetitor)
arena.tournament([
    ("Auburn", "Alabama", None, datetime(2017, 11, 25), 1.0),
])
print(arena.competitors["Auburn"].rating_history())
The fourth element of each tuple is the match time, and WHR wants it: the dates are what the per-day curve is built from. pip install elote==1.3.2.
Stay in the loop
Get notified when I publish new posts. No spam, unsubscribe anytime.